Finding opportunities. That’s what Analytics is all about, right? Find what’s working and then double down on that approach.
But you can also use Google Analytics to see if there are bugs, if anything is missing, if anything is broken. It’s a super fast way to audit your website.
You can often find big problems in just a few clicks.
Here is a 7-step website audit. It’s not a replacement for detailed testing, but Analytics a fast, efficient and free audit tool. You are just clicks away from the answers to each of these questions.
- Are there broken pages or bad URLs?
- Are there broken internal links between your pages?
- Is your site working well in every browser?
- Is your shopping cart broken on certain browsers? (e-commerce)
- Is your site not working on some devices?
- Is there a sudden drop in traffic?
- Are there searches with no search results?
We’ve included a bonus from a guest expert for more advanced Google Analytics/Google Tag Manager users at the end.
To make this guide easy, we’ll use a Q and A format. Each section is a question. The report with the answer to the question is listed next. Each section ends with a checklist for next steps.
1. Are there broken pages on your site?
Behavior > Site Content > Page Title dimension, filter for “Page Not Found”
If a visitor goes to a bad URL (a page that doesn’t exist) they arrive at a “404 Page Not Found” landing page.
Although visits to these non-existent URLs appear in your Site Content report, they all have different URLs, making them hard to find.
But they all have the same Page Title.
So find the title of your 404 page by intentionally going to a bad address on your site, such as http://www.yourwebsite.com/sdlfksjdlfksjdlfs.
ProTip: Enter your domain then let your cat jump on your keyboard. Or if you’re working from home with a kid on your lap, let them help.
Now look at the title in the browser tab. See it? On this site, it’s “Page not found.”
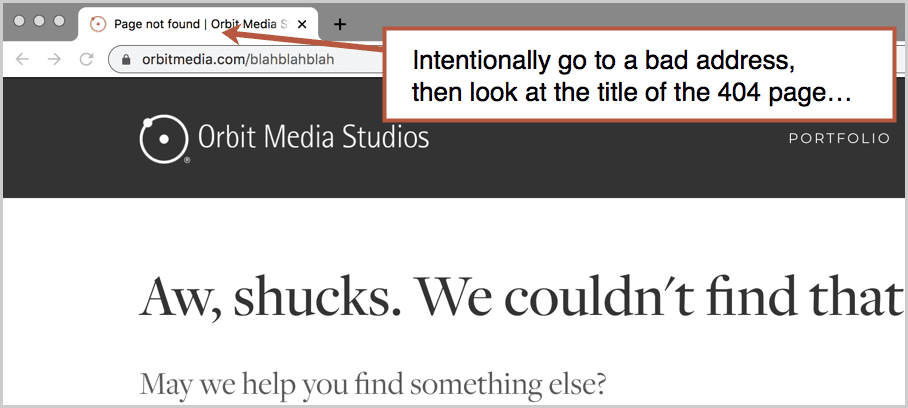
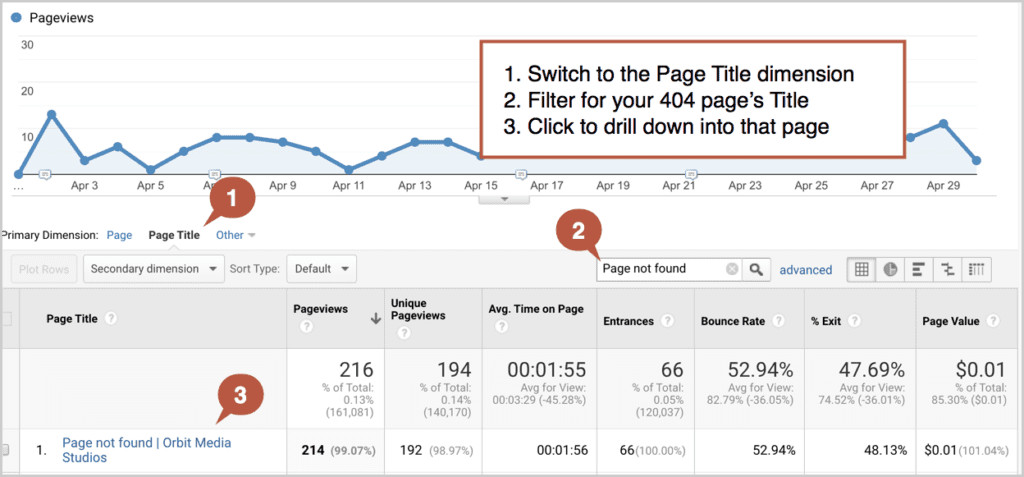
Now in Analytics, go to the Behavior > Site Content report. Switch to the Page Title dimension.

Then add the title of your 404 page into the filter box. You should now see a report with just one row: your page not found page.
Click on it.
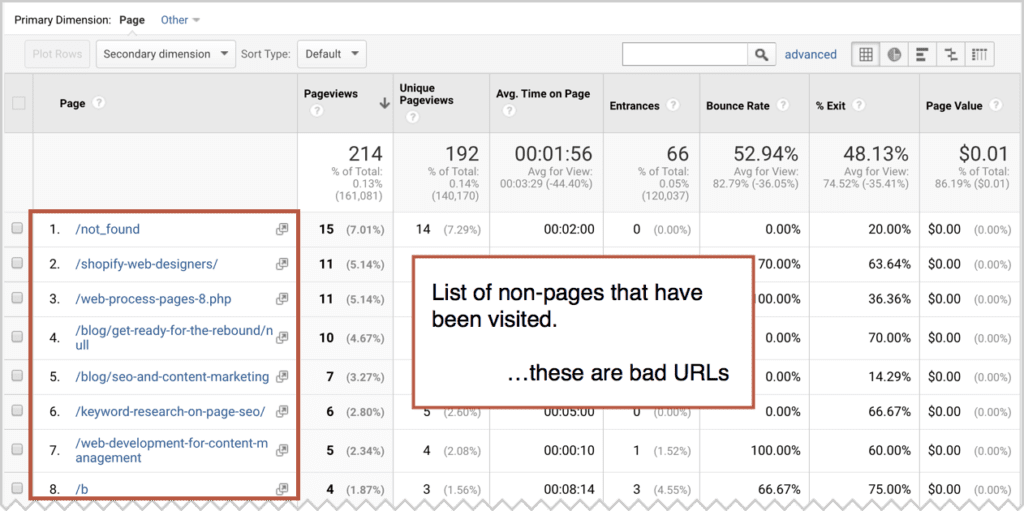
This drill-down brings you back to the Page dimension (the URL) but just for pages with that title. So now you’re looking at a list of every bad address on your website that has been visited at least one time during the date range set above the report.
These are your 404’s.
Next steps:
- Save the report by clicking the disk icon in the top right. Name it “404 Report”
- Add it to your favorite Google Analytics dashboard if you’re into that kind of thing
- Redirect traffic from these pages to the most relevant page (tell your web dev partner to make some 301 redirects)
- Or create content on these URLs!
- Make your 404 page awesome. Why not? Add links from it to other web pages. Add humor. Create an apology video. Or get really creative, like these examples:
-
- Poem: “Quoth the server: 404”
- Game: Klettke’s Zombie-themed dead page game
- Video: Impact’s Oopsie video
Next question: How did people get to these pages? Was it from internal links?
2. Are there broken internal links on your site?
Behavior > Site Content > Page Title dimension, filter for “Page Not Found” > Drill down > Navigation Summary, Previous Page Path
Are you the one driving traffic to these bad pages? Are there broken internal links?
From that same report (the list of all the 404 page URLs), click on any page in that first column, bringing you to the same report, with just one row: that 404 page.
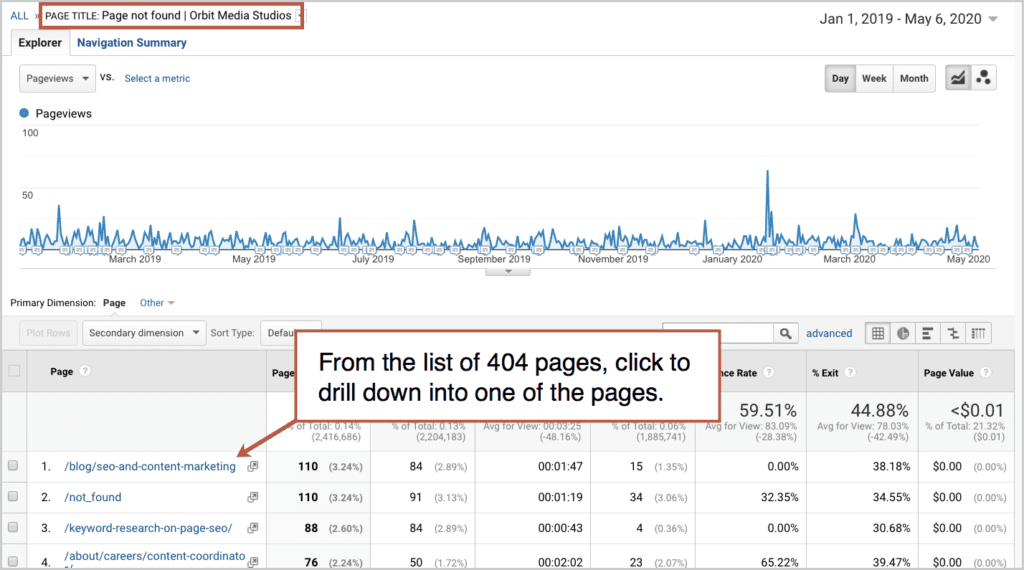
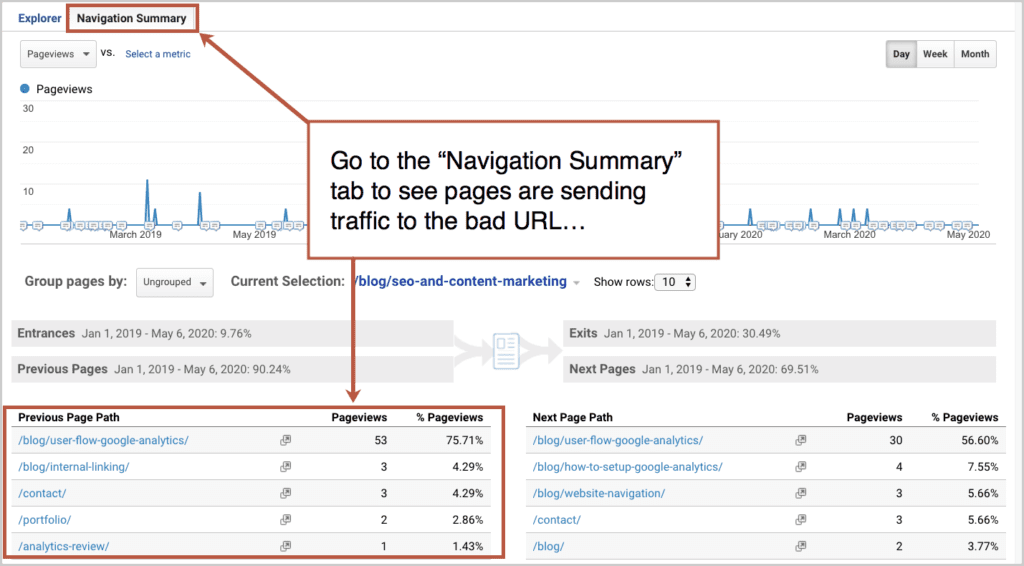
Now click on the “Navigation Summary” tab to see how people are getting to this page. Look at the pages in the “Previous Page Path” list. These are pages with broken internal links.
Next steps:
- Find the broken link on the page
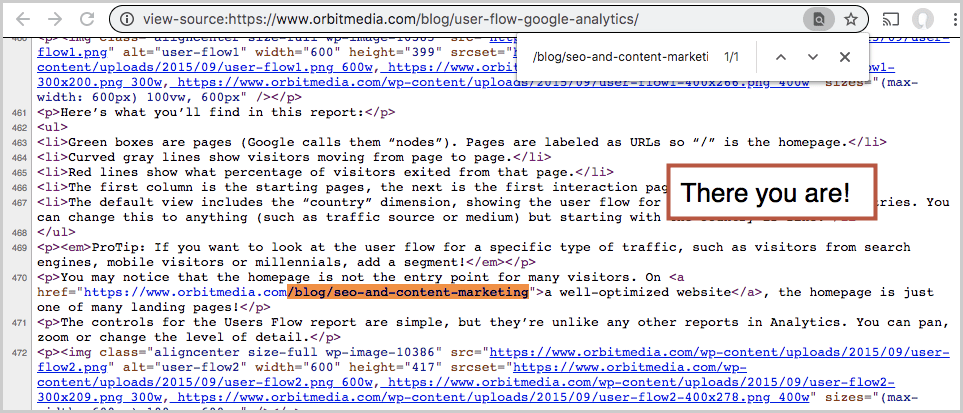
If you have trouble finding the broken link on those pages, you can view the source code of the page (by right clicking anywhere on the page and click “view page source” from the menu). Then use the find feature (control + F) to find the bad address in the code. - Remove the link or update it to point to another page
You can use these internal linking best practices to find the opportunities with the best SEO value.
Because Google Analytics is based on website behavior, this will only show links that are broken and clicked on. In other words, the links that actually affect user experience. If it’s never been clicked, it won’t show up.
ProTip: Use a paid SEO audit tool, which will check your site for all broken links (internal and external) along with other stuff that technical SEOs worry about, such as duplicate content in meta descriptions. But is that a ranking factor in search engines anyway? I think no.
3. Is your site working well in every browser?
Audience > Technology > Browser & OS (Bounce Rate)
If your website is mostly a set of pages without much fancy programming, it’s unlikely you have any browser compatibility issues. Especially if you’re CMS is up-to-date and doesn’t have a ton of plugins installed.
But why not check? It takes less than one minute.
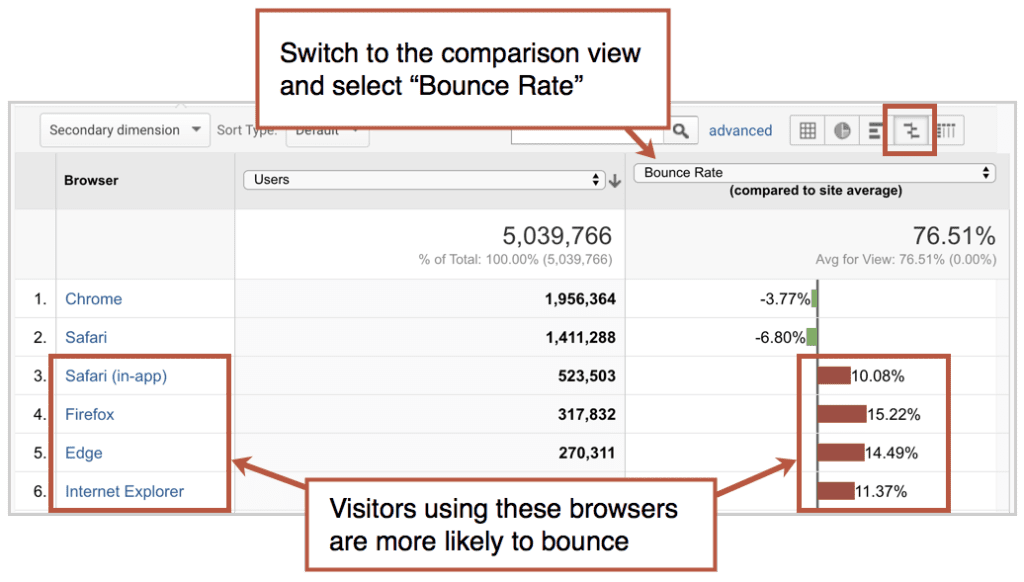
Go to the Audience > Technology > Browser & OS report. This report has a column for bounce rate, showing you the bounce rate for each browser, which is a clue that users of that browser are having issues.
Switch to the comparison view to quickly see if users of some browsers are much more likely to bounce than others. They should all be within a few percentage points of each other.
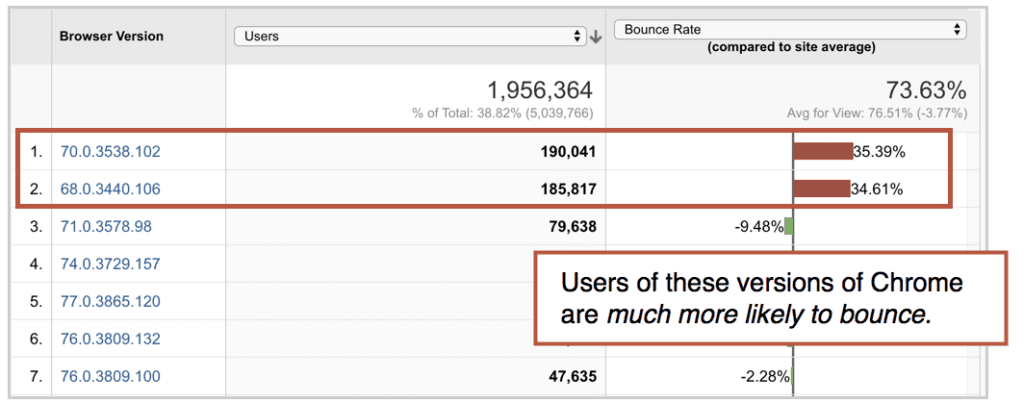
Drill down into each browser to see the full picture. You’re looking for outliers, checking to see if a certain version of a certain browser has a much higher bounce rate than the average for the website.
Next steps:
- Give the site a thorough browser compatibility test using a device with that browser
- …or use an emulator, such as BrowserStack to quickly test the site from your computer.
While you’re here, check to see what browsers your audience uses. Do your visitors love Internet Explorer 8? No problem. Analytics will show if those folks are enjoying your site.
4. Is your shopping cart broken on certain browsers?
Audience > Technology > Browser & OS (Conversion Rate)
If you have an ecommerce website, this same report can show you if your shopping cart has browser compatibility issues.
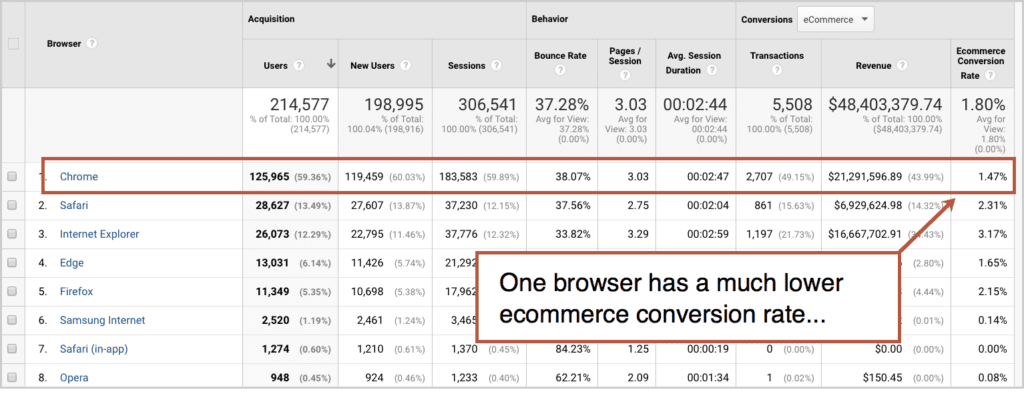
It’s possible that a bug is stopping some visitors from giving you money. Here’s what that looks like in Analytics.
You would expect ecommerce conversion rates to be similar across browsers. In this case, between two and three percent. But one browser, Chrome, has a much lower rate, about 1.5%.
Drilling down to see if the problem is with certain versions of Chrome, and the problem is suddenly obvious. For two versions, the conversion rate is close to zero. Users of these browsers are trying to buy but can’t.
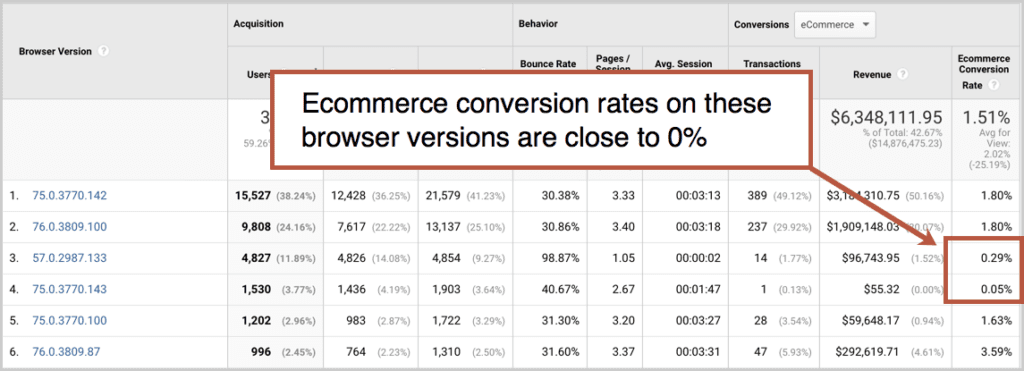
Look at the revenue column to get an idea for the hole this punches in sales. This is a million dollar bug. If you see this, your turbo website audit just found a lot of money in under a minute.
Browser issues are less likely for standard implementations of Woo Commerce and Shopify. They are more likely for more custom ecommerce with fancy carts.
Next steps:
- Take a deep breath, then send a support ticket to your developer.
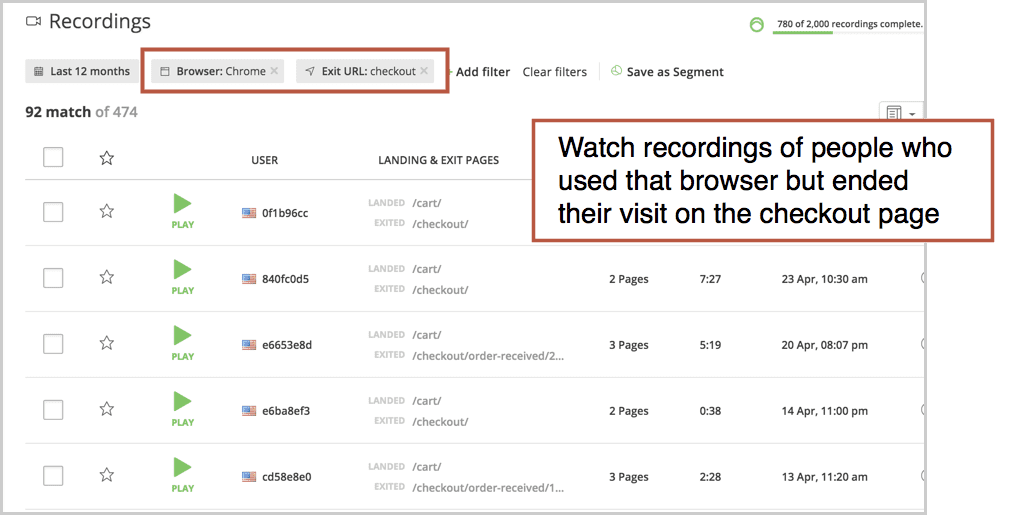
- …or join the struggle. Use HotJar or a similar tool and watch screen recordings of actual visitors. Watch visitors who used that browser but exited the site from the cart or checkout page.You may see some “rage clicking” of frustrated visitors pounding on buttons that don’t work.
5. Is your site not working on some devices?
Audience > Mobile > Devices (Bounce Rate)
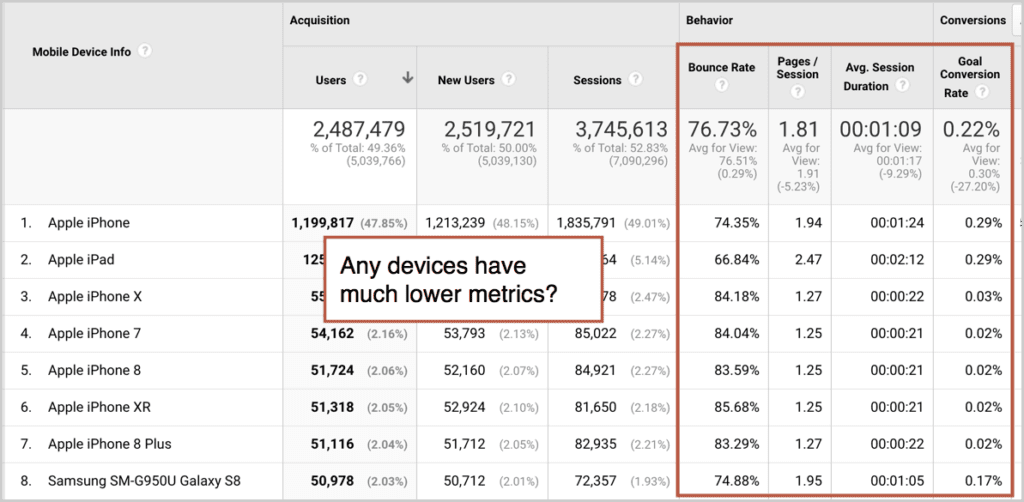
Engagement and conversion metrics naturally vary across devices. Even a very mobile-friendly site will have higher bounce rates and lower time on page than a desktop site.
But across mobile devices, there shouldn’t be a big variance across devices, where one device has much lower engagement and conversion metrics. If there are, your turbo website audit maybe have found a bug.
Next steps:
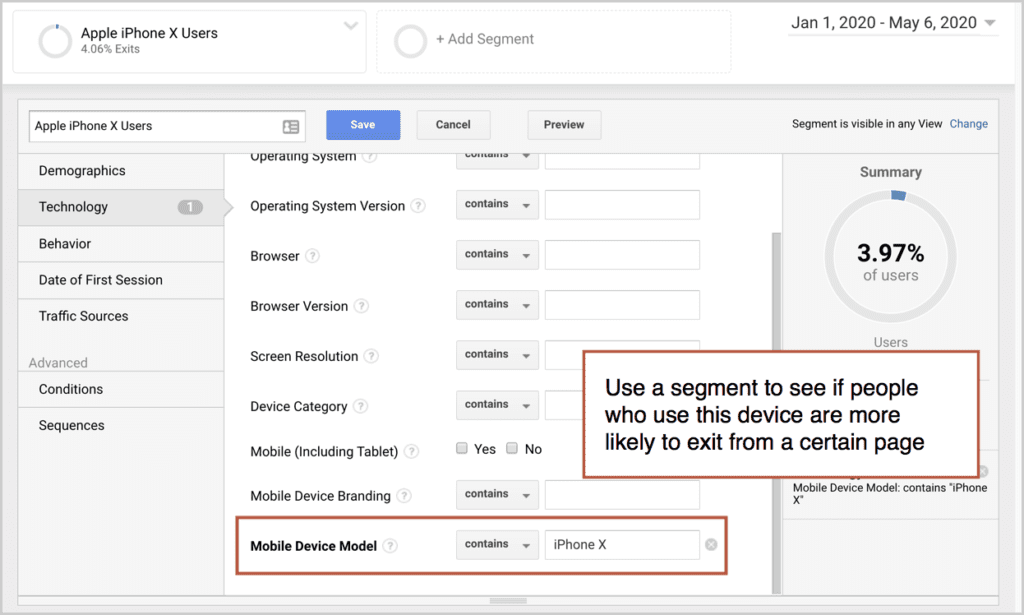
- Get a closer look at these visitors by creating a segment. “Mobile Device Model” is a dimension you can segment for in just a few clicks.
- Look at the exit page report for these visitors.
- Test the site on that device.
6. Is there a sudden drop in traffic?
Custom alert
It takes just seconds to set up. An alert from Google Analytics gives you another layer of notification for website downtime.
Ideally, your hosting partner gets an alert almost instantly if your website goes down. They get notified and take action before you even notice. But those server and DNS level alerts don’t get triggered if the problem is with Analytics itself.
A custom alert from GA will tell you if Analytics or Google Tag Manager somehow get unplugged.
Alerts are set up under the view, but can apply to many views. Here’s what a simple “Traffic Drop” alert will look like:
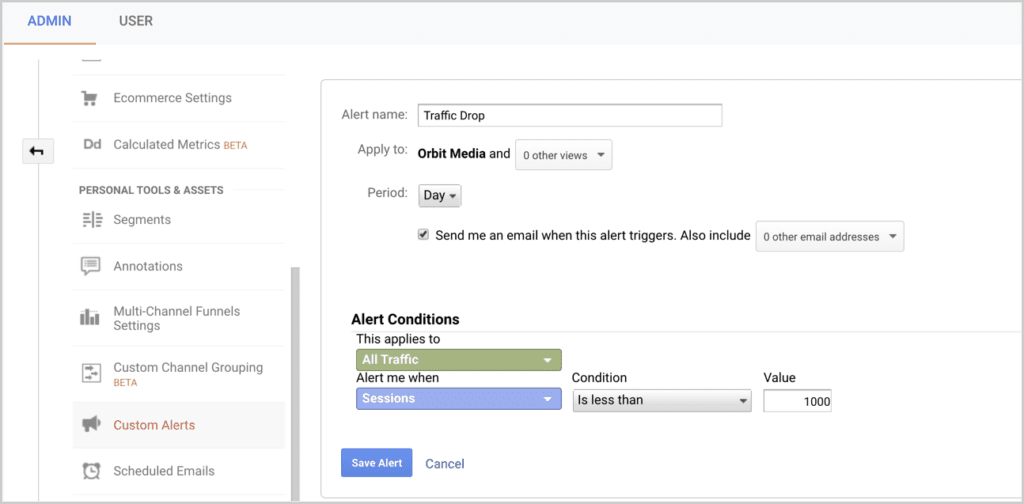
If set up correctly, you’ll get an email if the rules are met. Make sure that emails from noreply@google.com don’t get caught in your spam filter.
You’ll need “collaborate” level access to create a custom alert. “Read & Analyze” level access isn’t enough. Here’s a quick guide (with video) for managing permissions in Google Analytics.
7. Are there searches with no search results?
Behavior > Site Search > Search Terms (% Search Exits)
It’s not a bug, but it is a content gap. This is traditionally part of a content marketing audit (here is our 8-step process for auditing your content) but it’s fast so we’ll include it here in this site audit.
Here’s how to see if people are searching for something using your website’s search tool, but not finding it.
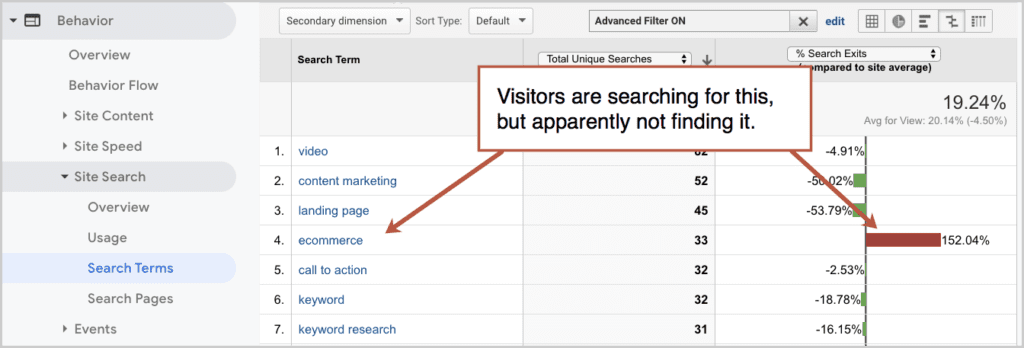
Go to the Site Search > Search Terms report. If set up properly (turned on with your query parameter entered) you’ll see a list of all the phrases visitors search for using your site’s search box.
On the right, you’ll see the engagement metrics for each search term, including % Search Exits, which is the percentage of visitors who leave without clicking on a search result.
Switch to the comparison view and the insight may leap out at you. If the % Search Exits is much higher that the average for the website, it’s likely that there aren’t good search results for that query.
Next steps:
- Search for all of these phrases using your website’s search tool. Like what you see?
- If you have content that isn’t ranking in your own search tool, optimize it by realigning it with the search term you found here.
- If you don’t have content for any of these topics, write it.
This is a flavor of SEO that everyone should love. Optimize your own content to rank in your own search tool on your own website. There is no competition.
ProTip: Apply “exit page” as a secondary dimension to this report to reference the last page people visit with the term they searched for. If people search for something but then leave from the search results page, they must not have found it. Here are detailed instructions for Site Search setup and analysis.
BONUS: Are visitors struggling to fill out our forms?
Behavior > Events > Pages
When a visitor is filling out a form, the website often tells them if they missed something or did something wrong. This is called “form validation.”
For example, they’re filling out your contact form and they skip a required field, like email. Or maybe they don’t enter a valid email address. The form gives them a little message like this:
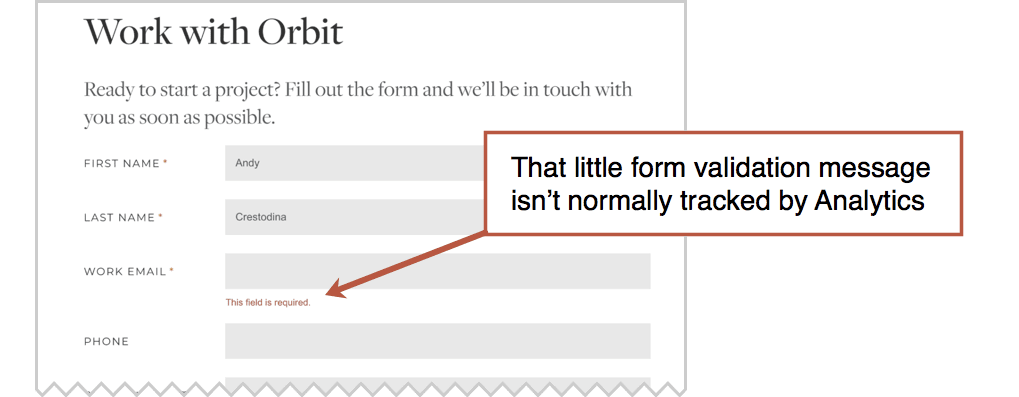
But that message isn’t a new pageview, so it isn’t tracked by Google Analytics by default. A thorough website audit might test every form to make sure it’s working, but it won’t show what percentage of visitors struggle to get it right.
The fix? Use Google Tag Manager to set up event tracking using an “Element Visibility” trigger. Once complete, Tag Manager will be listening for those little words from your form validation error to appear on the page. When they do, it will fire an event that will appear in Analytics.
When you review the Pages report in the events section, you can see how often that error message appears, showing you how much of a struggle your forms are for your visitors.
This is advanced. Rather than show all the screenshots for all the steps, I’m going to leave it to GTM expert, Julian of Measure School. This video shows all of the steps:
Next steps:
- Measure the correlation between errors and visitor abandonment. How much is this confusion costing you?
- Make sure your forms require only the fields that are truly necessary. No greedy forms.
- Check your form labels, instructions and error messages. Is everything clear?
- Create an event to report on errors, which Julian recommends…
 |
Julian Juenemann, MEASURE SCHOOL“If you want to automate going through these steps, you can also create an Event report. It works by firing a Google Analytics event with the help of Google Tag Manager every time a user encounters an Error page. Simply create a GTM trigger based on the page title or a DOM element and fire a Google Analytics Event Tag that transports the URL and the referring page to Google Analytics.” |
Your visitors are telling you something. Use Analytics to listen.
They’re trying to tell you something through your Analytics data. That’s really all Analytics is: information about the behavior of your visitors.
If your website was a physical space, you could sit back and watch them. See if they struggle to move around, to find things and to buy.
But since our visitors aren’t here, we can’t watch them physically. We use javascript tracking code and cookies instead. The clues are in your Google Analytics account.
The good news? Those clues are just a few clicks away.
The post The 3.5-Minute Google Analytics-Driven Website Audit: How to Find Bugs, Bad URLs and Broken Links on Your Website Using Analytics appeared first on Orbit Media Studios.
from Orbit Media Studios https://www.orbitmedia.com/blog/website-audit-google-analytics/
via IFTTT
from
https://sarahbarnett0.wordpress.com/2020/05/13/the-3-5-minute-google-analytics-driven-website-audit-how-to-find-bugs-bad-urls-and-broken-links-on-your-website-using-analytics/
No comments:
Post a Comment